# Fix the random numbers by setting the seed # This enables the analysis to be reproducible when random numbers are used set.seed(222)# Put 3/4 of the data into the training set data_split <-initial_split(d, prop =3/4)# Create data frames for the two sets:train_data <-training(data_split)test_data <-testing(data_split)
Creating Recipe and Workflow:
Create New Recipe Between Nausea and All Other Variables
flu_rec<-recipe(Nausea ~ ., data = train_data) %>%step_dummy(all_nominal(), -all_outcomes()) %>%step_nzv(all_predictors())tidy(flu_rec)
# A tibble: 2 × 6
  number operation type  trained skip  id
   <int> <chr>     <chr> <lgl>   <lgl> <chr>
1      1 step      dummy FALSE   FALSE dummy_FvN9r
2      2 step      nzv   FALSE   FALSE nzv_XeMK7
This shows the probabilities of either Yes or No for flu symptoms.
Evaluate Performance:
Test Data
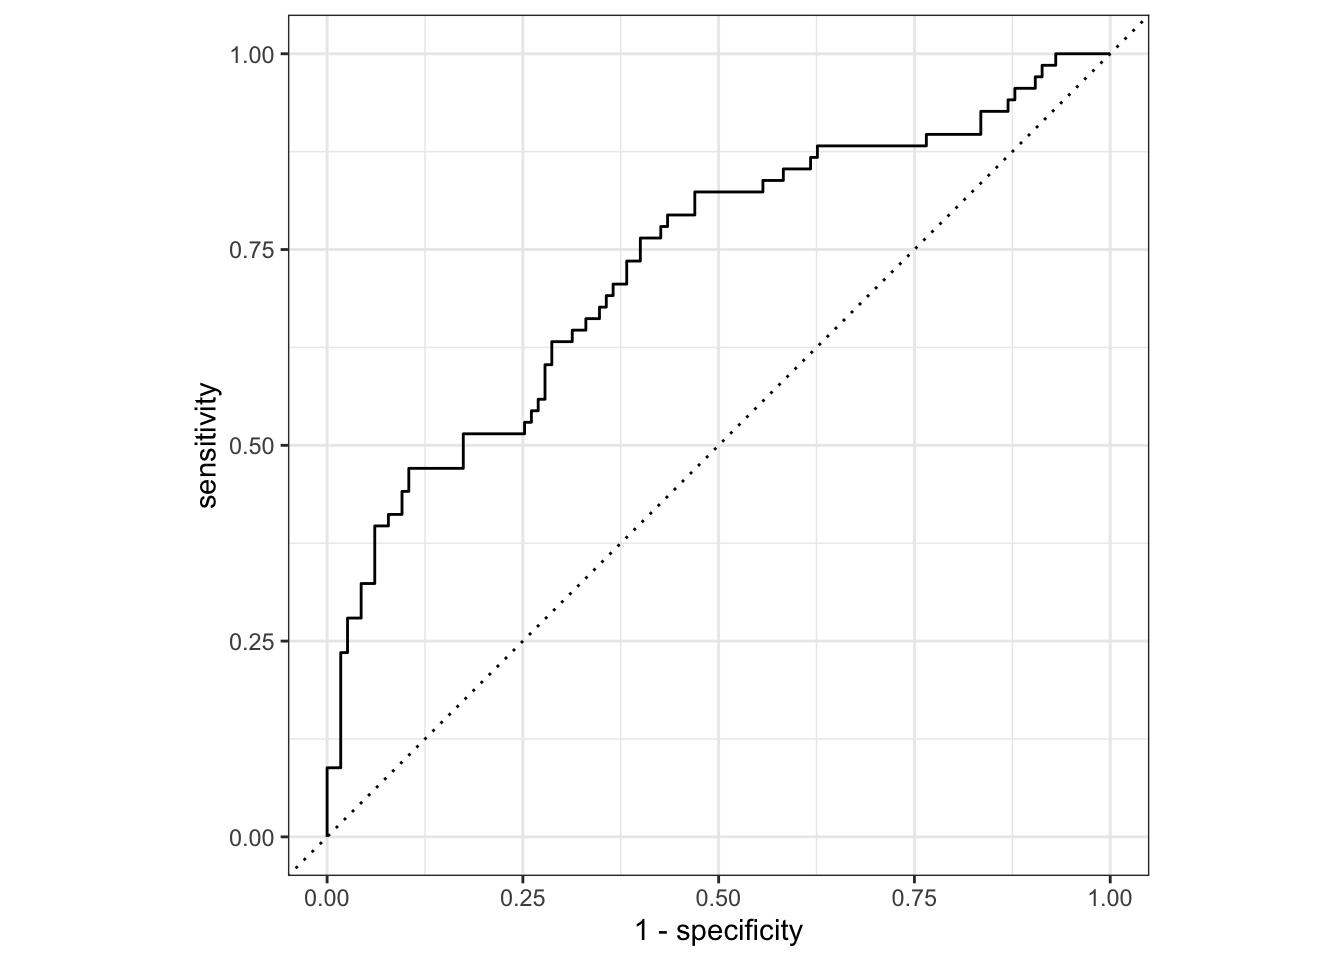
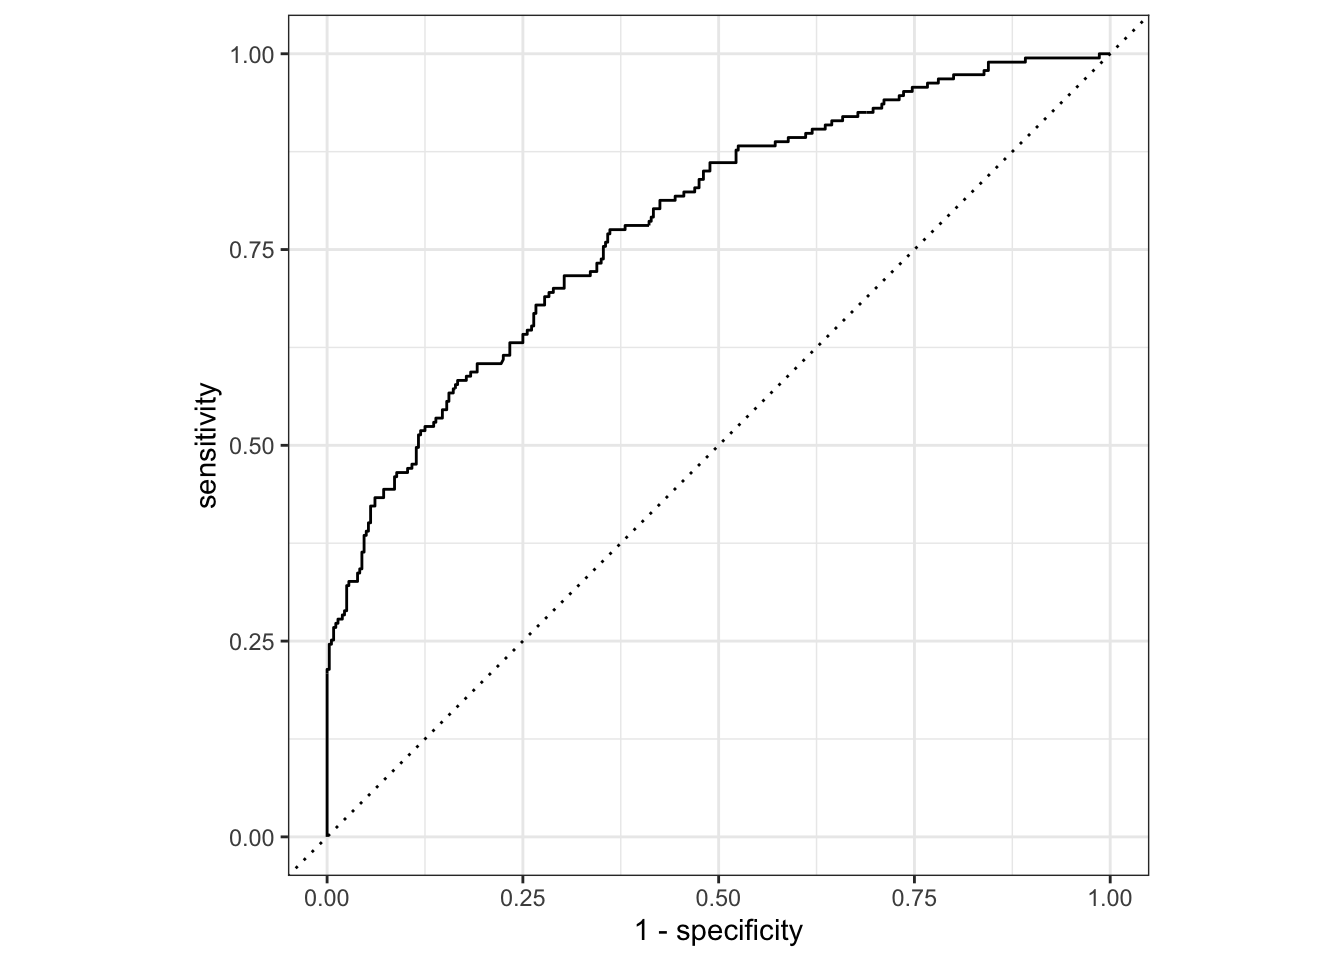
ROC Curve
flu_aug_test %>%roc_curve(truth = Nausea, .pred_Yes, event_level ="second") %>%#> For binary classification, the first factor level is assumed to be the event. Use the argument `event_level = "second"` to alter this as needed.autoplot()
Warning: Returning more (or less) than 1 row per `summarise()` group was deprecated in
dplyr 1.1.0.
ℹ Please use `reframe()` instead.
ℹ When switching from `summarise()` to `reframe()`, remember that `reframe()`
  always returns an ungrouped data frame and adjust accordingly.
ℹ The deprecated feature was likely used in the yardstick package.
  Please report the issue at <https://github.com/tidymodels/yardstick/issues>.
# A tibble: 1 × 3
  .metric .estimator .estimate
  <chr>   <chr>          <dbl>
1 rmse    standard        1.13
Our training data out preformed our test data, estimates 1.2 and 1.12 respectively. Thus, runny nose does not seem like a predictor of body temperature.